



A sales supervisor may need to check open orders, recent invoices, and pending deliveries every morning. Opening each list separately works, but it takes time to move between screens and repeat the same checks.
The General Overview in SAP Business One Web Client lets you bring several sets of information together on one page. Each card can use a different data source, so you can build a dashboard around the information you need for your work.
Decide What You Want to Monitor
Start with a few clear questions. For example:
- Which customers have the highest open order values?
- How are invoice values distributed across customers?
- Which deliveries still need follow-up?
Choose the available data sources and measures that answer those questions. Keep the first version simple; three useful cards are easier to review than a page full of charts.
Set Up the Cards
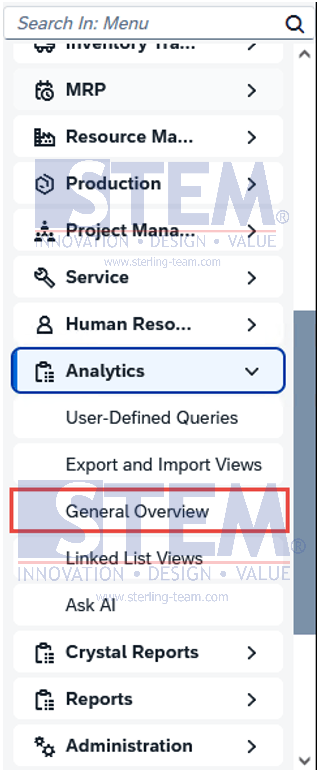
- Open General Overview from the Analytics group.
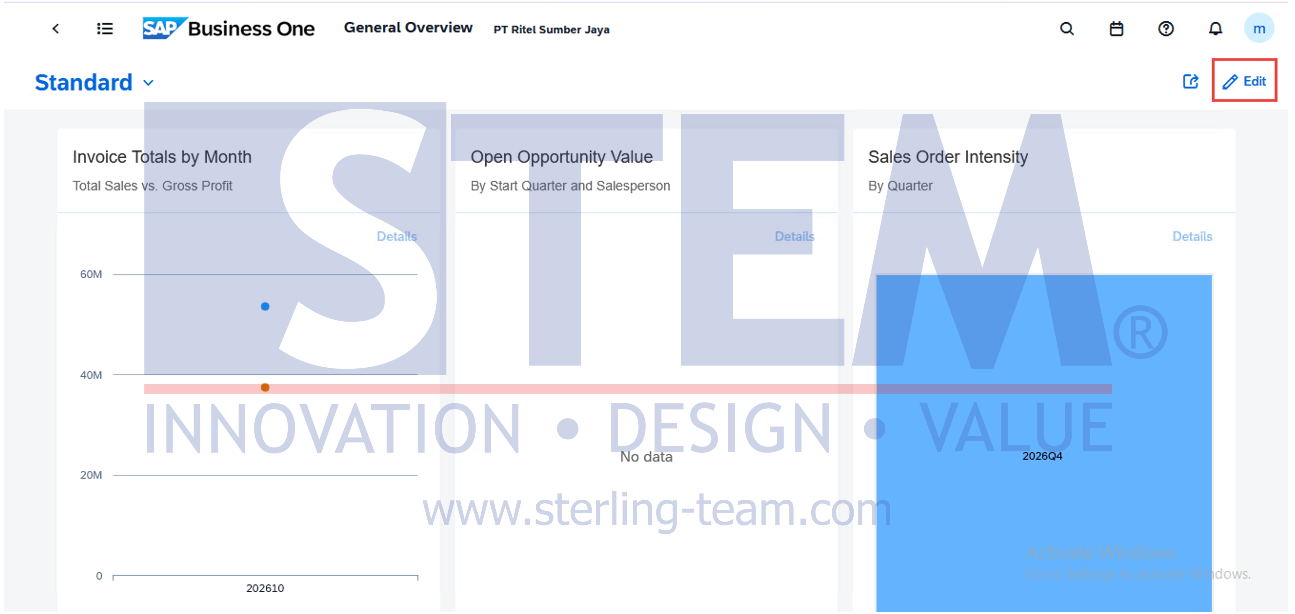
- Select Edit to customize the overview.
- Click the edit icon on a card.
- In Configuration, choose the required Data Source.
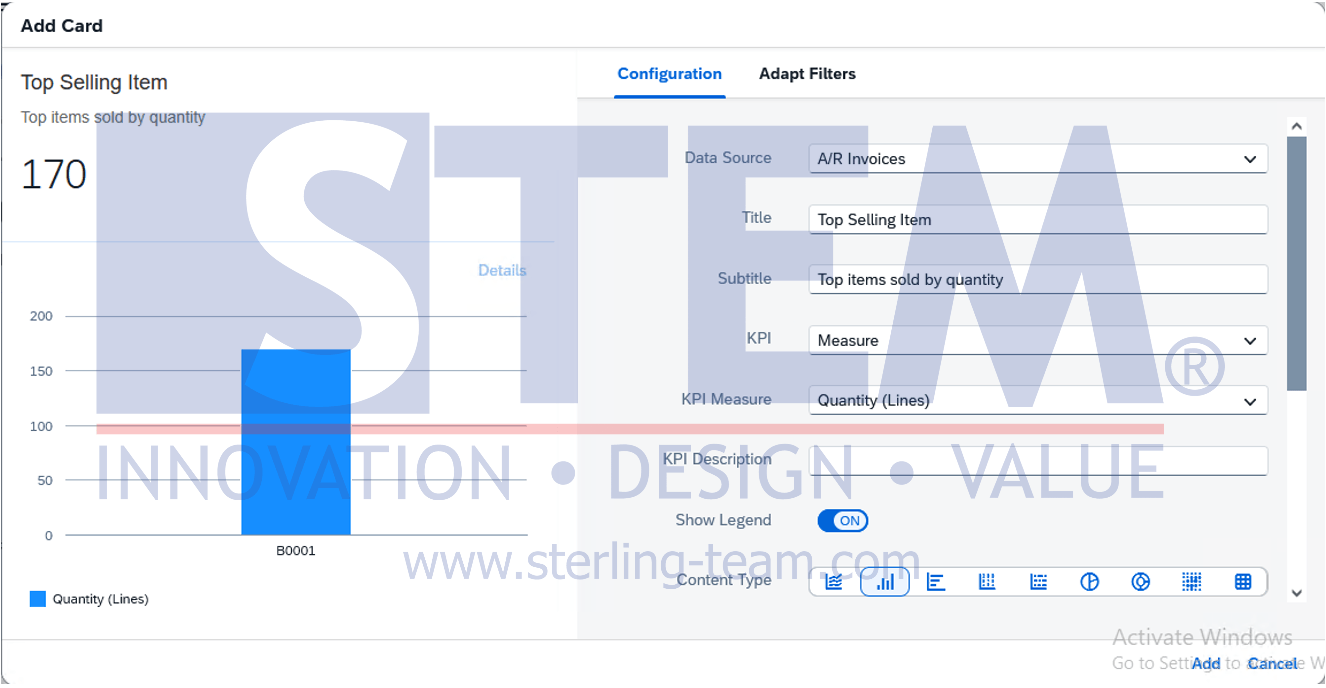
- Set the chart details, such as the measure and dimensions.
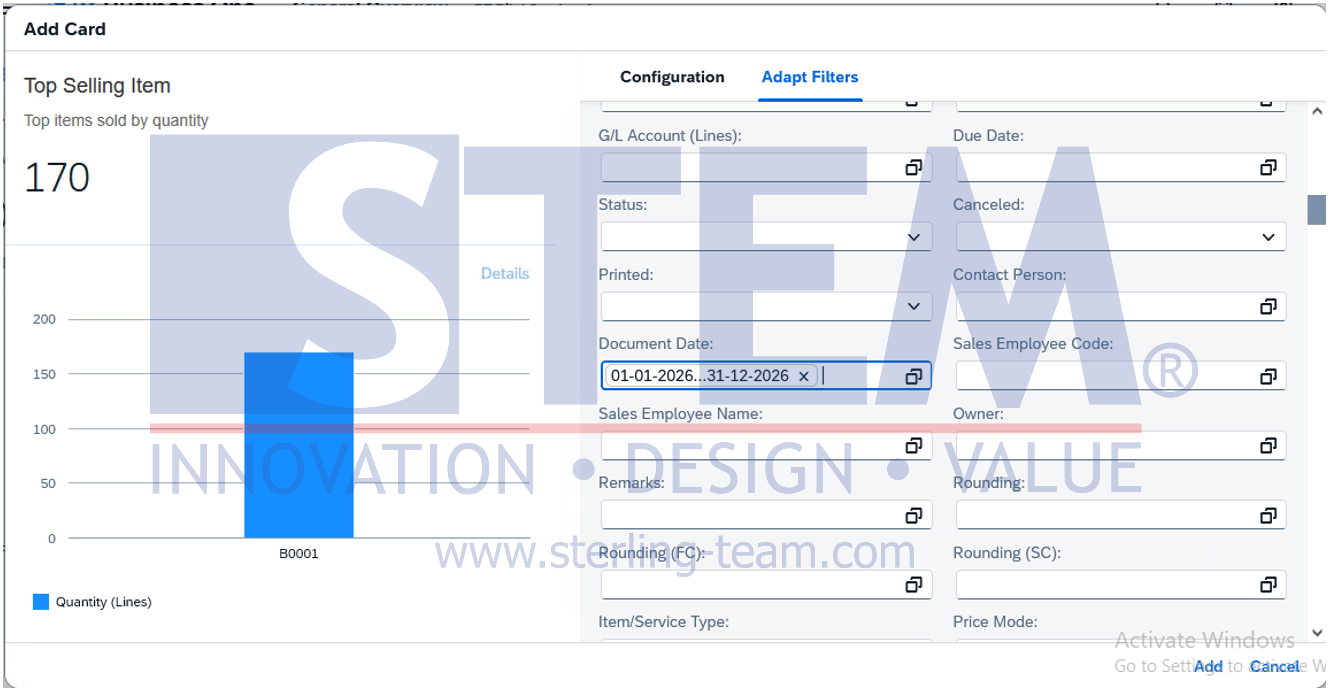
- Open Adapt Filters and define the conditions for that card.
- Apply the card settings and repeat for the other cards.
Choose the data source before making detailed adjustments. Changing it later replaces the card’s settings with those of the new source.
Check Each Card’s Filters
General Overview does not use one common filter bar for all cards. Each card has its own filters.
For a monthly review, check that all relevant cards cover the intended month. A sales order card showing all open orders and an invoice card showing only this month’s invoices answer different questions, even when displayed side by side.
Give each card a descriptive title so the scope is clear.
Save Your Dashboard
After completing the layout, use Save As from the view menu to save it under a name such as Sales Team Overview.
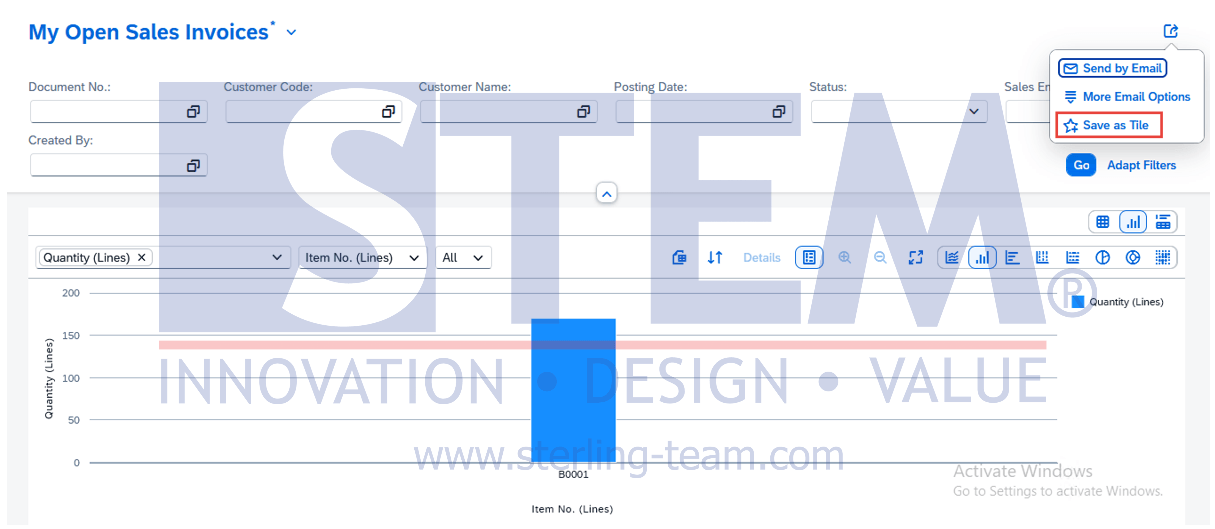
You can also use Share → Save as Tile to add a shortcut to your home page.
Before using the dashboard regularly, compare a few results with their source lists. This helps confirm that the selected filters and measures show the information you intended.
Also read relevant SAP Business One Tips:
- How to Add an Open Sales Orders Shortcut in SAP B1 Web Client
- Show Only the Columns You Need in SAP Business One Web Client
- How to Turn a Document List into a Chart in SAP B1
- Generate Pick List for Multiple Sales Orders SAP B1
- Ctrl+Tab Function in SAP Business One Warehouse
- View Source Documents Behind Charts in SAP Business One