



In financial analysis, comparing a company’s performance across different periods is an important step to understand business growth, operational efficiency, and changes in financial conditions. SAP Business One provides a dedicated feature that allows users to compare financial reports directly within a single view.
With this feature, users can easily compare financial data from two different time periods, for example between fiscal years 2023 and 2024, without the need to export data or perform manual calculations.
Types of Financial Reports That Can Be Compared
SAP Business One provides three main types of financial reports that can be compared:
- Balance Sheet
To view the company’s financial position, including assets, liabilities, and equity. - Trial Balance
To ensure that total debits and credits are balanced within a specific period. - Profit and Loss Statement
To analyze company performance based on revenues and expenses.
How to Access the Comparison Menu
To compare financial reports, follow these steps:
- Go to: Financials > Financial Reports > Comparison
- Select the type of report you want to compare:
- Balance Sheet Comparison
- Trial Balance Comparison
- Profit and Loss Statement Comparison
- In the Selection Criteria window, define the two periods to be compared.
- The system will automatically display:
- Values for each period
- Difference Amount
- Percentage Difference
Example: Profit and Loss Statement Comparison
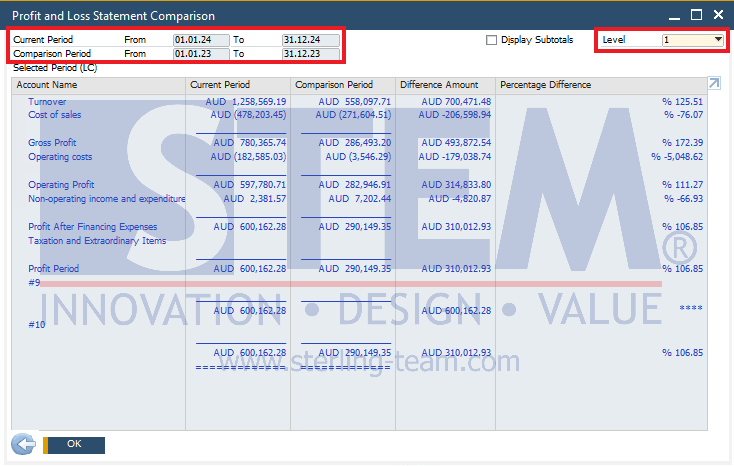
In the Profit and Loss Statement Comparison report, the system displays a side-by-side comparison of two periods within a single table. You can review changes in:
- Revenue / Turnover
- Cost of Sales
- Gross Profit
- Operating Profit
- Net Profit
Each account shows whether there is an increase or decrease, both in nominal value and percentage. This makes it easier to quickly and accurately analyze business performance.
At the top-right corner of the report, there is also an option to select the G/L Account Level to be displayed. The higher the level selected, the more detailed the account information shown in the report.
Benefits of Using Comparison Reports
- Speeds up financial performance analysis
- Helps identify increasing or decreasing trends
- Supports data-driven decision making
- Reduces the need for manual data processing